Lab - Implement Flexible NetFlow
Topology
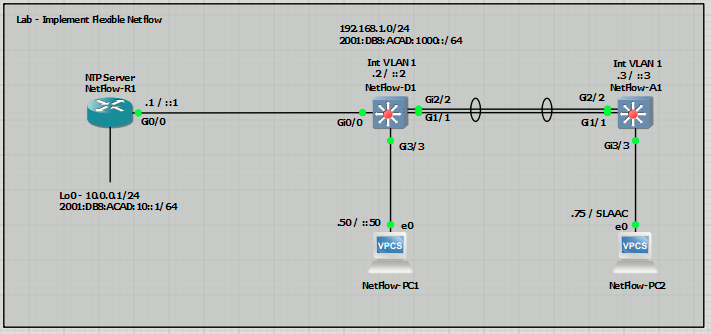
Addressing Table
| Device | Interface | IP Address | IPv6 Address | IPv6 Link Local |
| R1 | G0/0/1 | 192.168.1.1/24 | 2001:db8:acad:1000::1/64 | fe80::1:1 |
| Loopback0 | 10.0.0.1/24 | 2001:db8:acad:10:1/64 | fe80::1:2 | |
| D1 | VLAN 1 | 192.168.1.2/24 | 2001:db8:acad:1000::2/64 | fe80::d1:1 |
| A1 | VLAN 1 | 192.168.1.3/24 | 2001:db8:acad:1000::3/64 | fe80::a1:1 |
| PC1 | NIC | 192.168.1.50/24 | 2001:db8:acad:1000::50/64 | EUI-64 |
| PC2 | NIC | 192.168.1.75/24 | Assigned by SLAAC | EUI-64 |
Objectives
- Part 1: Configure basic settings for each device.
- Part 2: Configure and Verify Flexible Netflow
Background / Scenario
NetFlow is a Cisco IOS feature that summarizes packet activity into flows so you can understand who is talking to whom, on which ports, and for how long. Instead of inspecting every packet, the router or switch groups packets with the same key attributes into a single flow and records statistics for that flow. This creates rich operational data while keeping overhead manageable.
A flow is typically identified by a 5‑tuple: source IP, destination IP, source port, destination port, and IP protocol. Devices maintain a flow cache, update counters as packets pass, and export flow records at intervals to an external collector for storage and analysis. The resulting data supports network and security monitoring, capacity planning, traffic analysis, and IP accounting. Common tasks include identifying top talkers, spotting unusual traffic spikes, and understanding application usage across interfaces.
Flexible NetFlow extends the original NetFlow by letting you choose exactly which fields to match on and which statistics to collect. It uses a template-driven approach so you can tailor records to the applications and policies that matter in your environment. This flexibility makes it easier to align visibility with compliance needs, security workflows, and troubleshooting goals.
In this lab, you will configure and verify Flexible NetFlow using a flow record, monitor, and exporter to collect and export traffic data. You will then validate results by reviewing the flow cache and exported records.
Note: This lab is an exercise in configuring options available for Flexible Netflow and does not necessarily
reflect network troubleshooting best practices
Required Resources - Sergio Jimenez's Version
For this lab I am using GNS3 where I have deployed:
- 1 IOSv router
- 2 IOSvL2 switches
- 2 VPCs
Instructions
Part 1: Configure basic settings for each device.
NetFlow-R1
hostname R1
no ip domain lookup
ipv6 unicast-routing
username admin privilege 15 secret cisco123
banner motd # R1, Implement Flexible Netflow #
line con 0
exec-timeout 0 0
logging synchronous
exit
line vty 0 4
privilege level 15
exec-timeout 0 0
login local
transport input ssh
exit
interface g0/0
ip address 192.168.1.1 255.255.255.0
ipv6 address fe80::1:1 link-local
ipv6 address 2001:db8:acad:1000::1/64
no shutdown
exit
interface loopback 0
ip address 10.0.0.1 255.255.255.0
ipv6 address fe80::1:2 link-local
ipv6 address 2001:db8:acad:10::1/64
no shutdown
exit
ntp master 3
ip domain name CCNP
crypto key generate rsa modulus 2048
ip ssh version 2
end
NetFlow-D1
hostname D1
no ip domain lookup
no ip routing
ipv6 unicast-routing
banner motd # D1, Implement Flexible Netflow #
line con 0
exec-timeout 0 0
logging synchronous
line vty 0 4
privilege level 15
exec-timeout 0 0
password cisco123
login
interface vlan 1
ip address 192.168.1.2 255.255.255.0
ipv6 address fe80::d1:1 link-local
ipv6 address 2001:db8:acad:1000::2/64
no shutdown
ip default-gateway 192.168.1.1
interface g3/3
spanning-tree portfast
switchport mode access
no shutdown
interface g0/0
spanning-tree portfast
switchport mode access
no shutdown
interface range g1/1,g2/2
switchport trunk encapsulation dot1q
switchport mode trunk
channel-group 1 mode active
no shutdown
ntp server 192.168.1.1
end
NetFlow-A1
hostname A1
no ip domain lookup
no ip routing
ipv6 unicast-routing
banner motd # A1, Implement Flexible Netflow #
line con 0
exec-timeout 0 0
logging synchronous
line vty 0 4
privilege level 15
exec-timeout 0 0
password cisco123
login
interface vlan 1
ip address 192.168.1.3 255.255.255.0
ipv6 address fe80::a1:1 link-local
ipv6 address 2001:db8:acad:1000::3/64
no shutdown
ip default-gateway 192.168.1.1
interface range g1/1,g2/2
switchport trunk encapsulation dot1q
switchport mode trunk
channel-group 1 mode active
no shutdown
interface g3/3
switchport mode access
spanning-tree portfast
no shutdown
ntp server 192.168.1.1
end
End-to-end connectivity verification:
From R1 to PC2:

From PC1 to R1:
=255 time=4.525 ms
84 bytes from 192.168.1.1 icmp_seq=3 ttl=2
Part 2: Configure and Verify Flexible NetFlow
As previously stated, Flexible NetFlow provides the ability to customize traffic analysis parameters. The workflow for Flexible NetFlow consists of four steps:
- Create Flow Records. Flow records define the information to be collected. There are predefined flow records so you can configure your own custom flow record to suit your needs.
- Create Flow Exporter. This defines where compiled statistical information is sent.
- Create Flow Monitor and associate Flow Records and Flow Exporters with it.
- Configure the appropriate interface for input or output caching associated with the appropriate Flow Monitor.
In this part of the lab, you will configure Flexible NetFlow to send statistical information about R1 interface g0/0 to PC1.
Step 1: Create flow records.
- For our first flow record, we will use the predefined ipv4 original-input flow record. Because it is predefined, there is no configuration necessary.
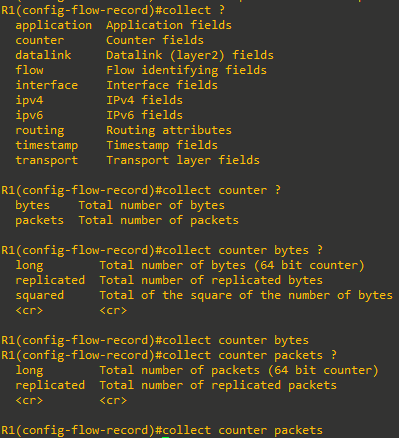
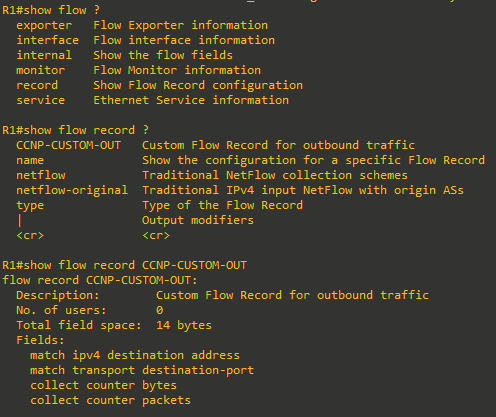
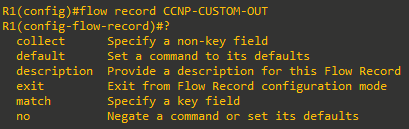
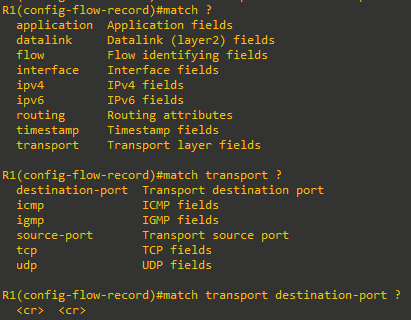
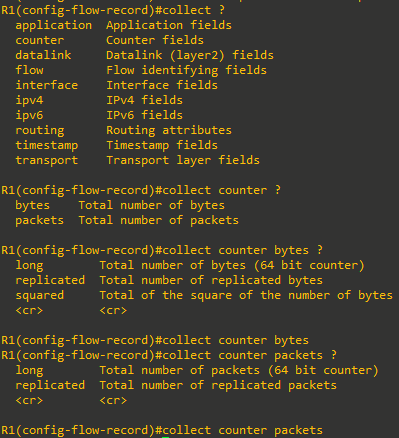
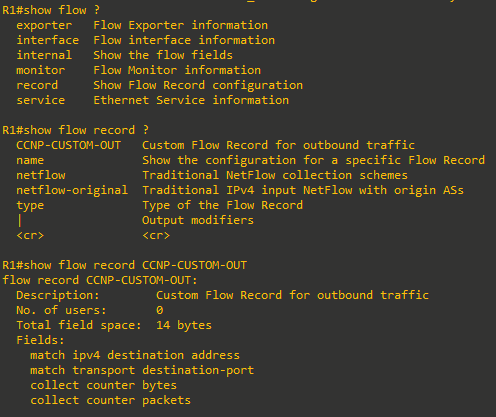
- For our second flow record, we will create a custom flow record. Because the first flow record is focused on input traffic, the second will focus on output traffic. Create a flow record named CCNP-CUSTOM-OUT.
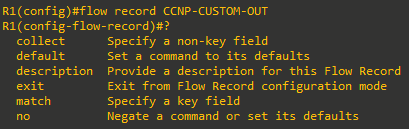
- Give the flow record a description

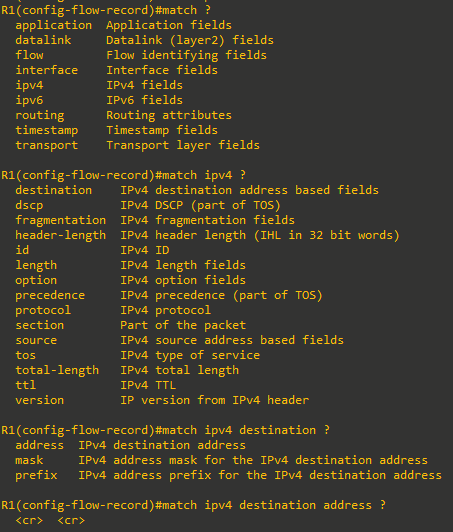
- Set up the flow record to match ipv4 destination address and transport destination
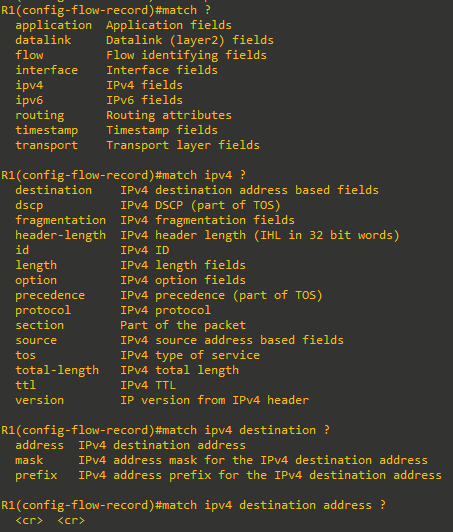
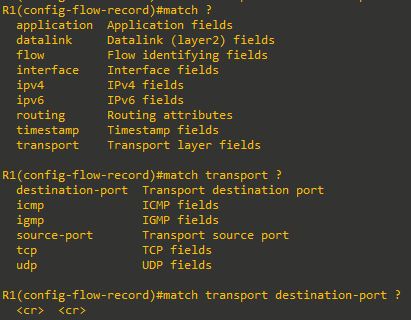
- Set up the flow record to collect bytes and packets
- Use the show flow record CCNP-CUSTOM-OUT command to examine the results.
- Give the flow record a description

Step 2: Create a flow exporter
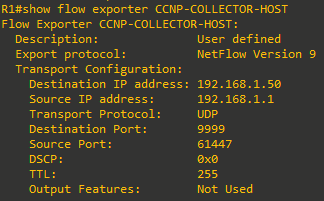
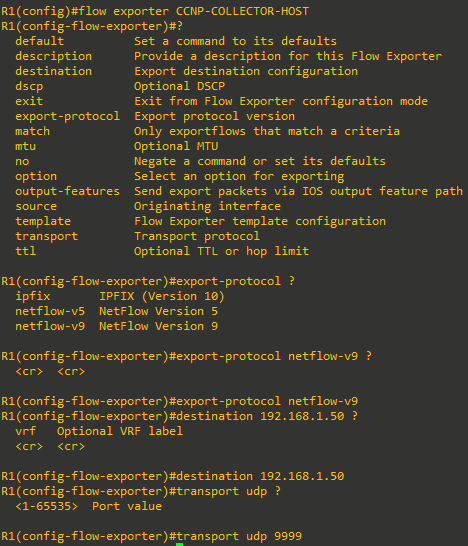
- The flow exporter configuration defines where the cached information will be sent. Create a flow exporter named CCNP-COLLECTOR-HOST. Further specify that the exporter should use Netflow version 9, and point to 192.168.1.50 udp port 9999
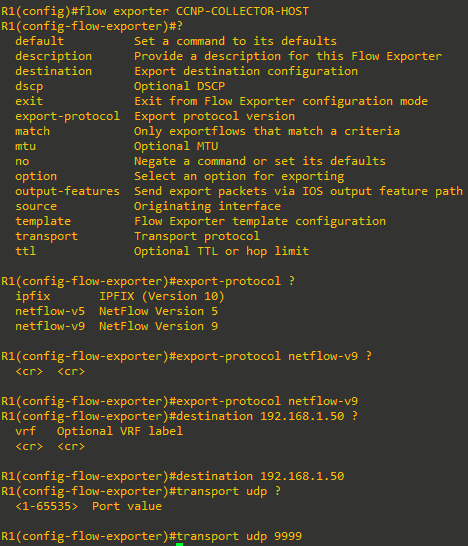
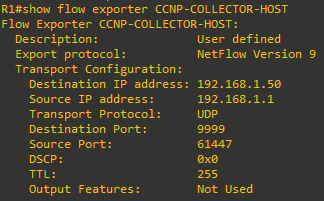
- Use the show flow exporter CCNP-COLLECTOR-HOST command to examine the results.
Step 3: Create flow monitors
The flow monitor associates a flow record with the flow exporter. For our exercise, we need to create two flow monitors, one for each flow record.
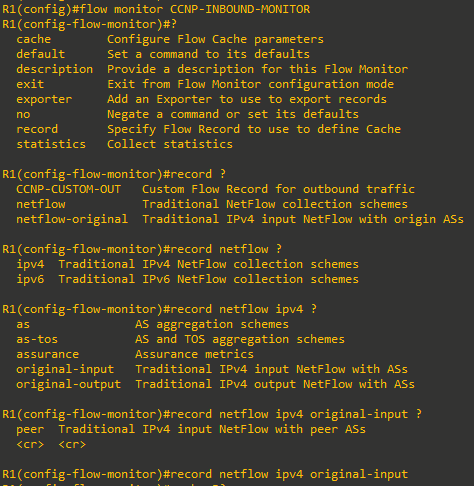
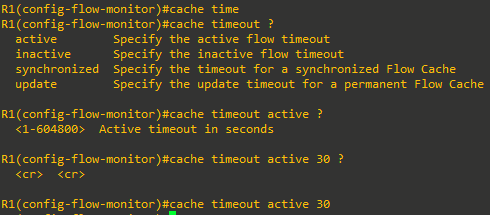
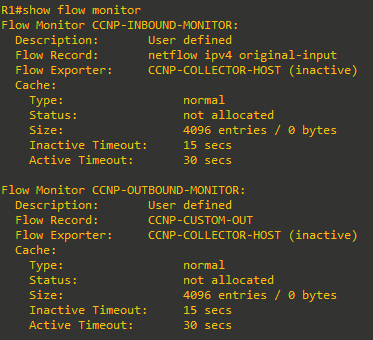
- Create the first flow monitor and name it CCNP-INBOUND-MONITOR using the flow monitor CCNP-INBOUND-MONITOR command. As part of the flow monitor, specify that it will record the netflow ipv4 original-input flow record, export the cache to the exporter every 30 seconds, and identify CCNP-COLLECTOR-HOST as the exporter.
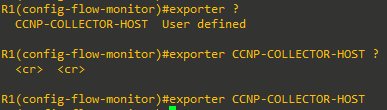
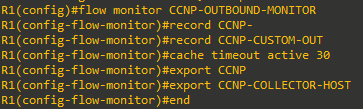
- Create the second flow monitor and name it CCNP-OUTBOUND-MONITOR using the flow monitor CCNP-OUTBOUND-MONITOR command. As part of the flow monitor, specify that it will record the CCNP-CUSTOM-OUT flow record, export the cache to the exporter every 30 seconds, and identify CCNP-COLLECTOR-HOST as the exporter.
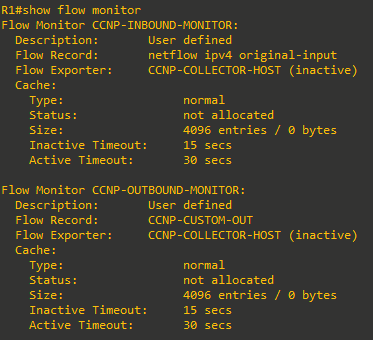
- Use the show flow monitor command to examine the results.
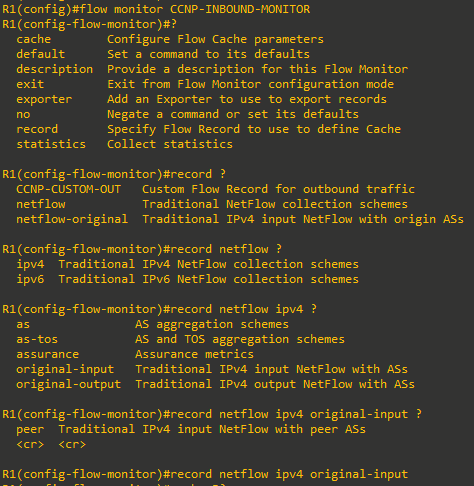
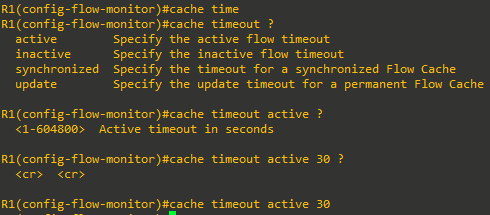
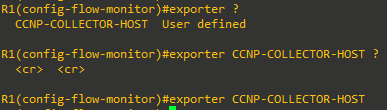
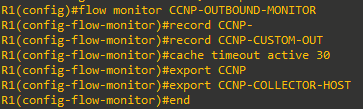
Step 4: Configure the interface for flow caching
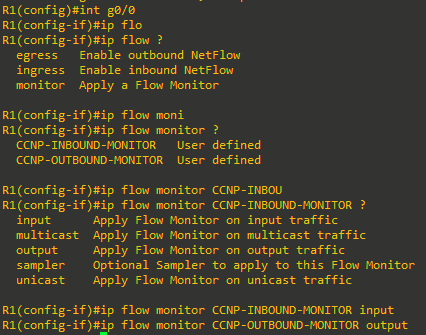
The last step is to configure the appropriate interface(s) so that they will cache information. In our lab, we will focus on the input and output from interface g0/0 on R1. Use the ip flow monitor command <name> <direction> command on g0/0 to specify the inbound and outbound flow monitors you have created.
Step 5: Create some traffic
To gather statistics, we will need some traffic.
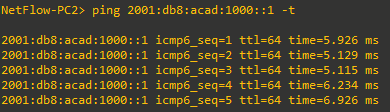
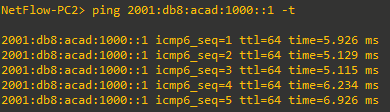
- From PC2, open two Command Prompt windows and start a continuous ping to R1 using IPv4 and IPv6.

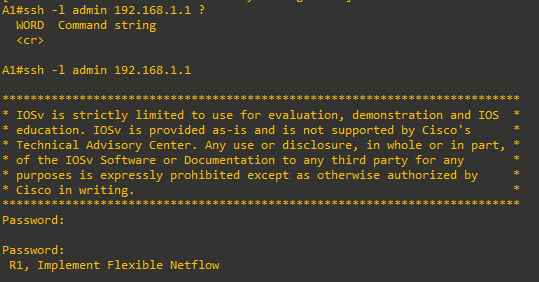
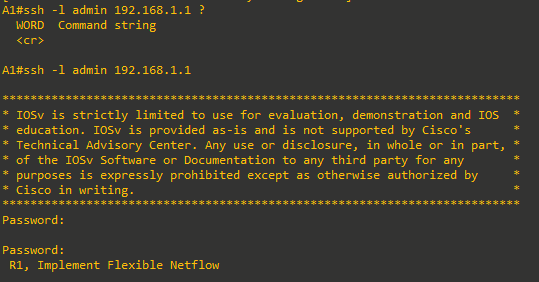
- From switch A1, SSH to R1 using the user account admin / cisco123. Login and leave the session running
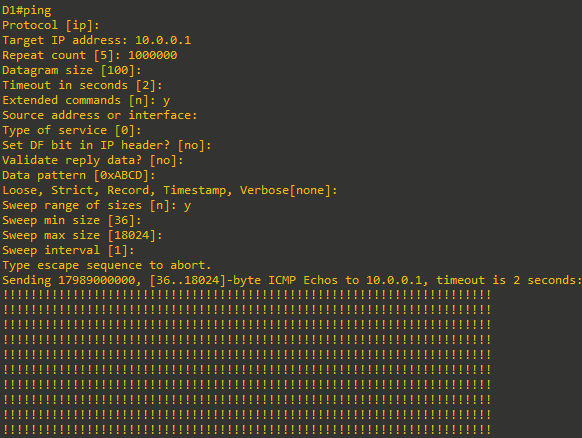
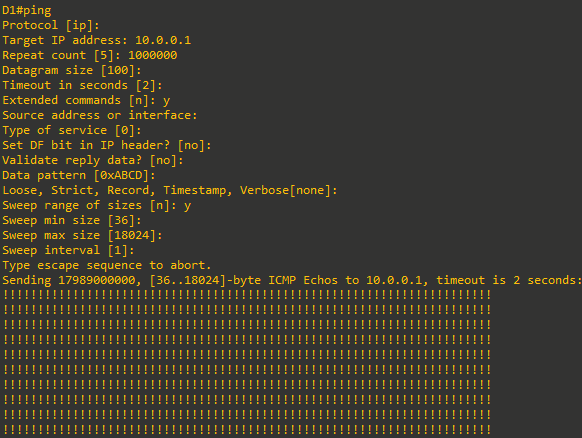
- From switch D1, use the extended ping utility to send pings to R1 Loopback 0 using a sweep range of 36 bytes to 18024 bytes. Set the repeat count to 1,000,000 and the sweep interval to 1.

Step 6: Wait 60 seconds then examine the results
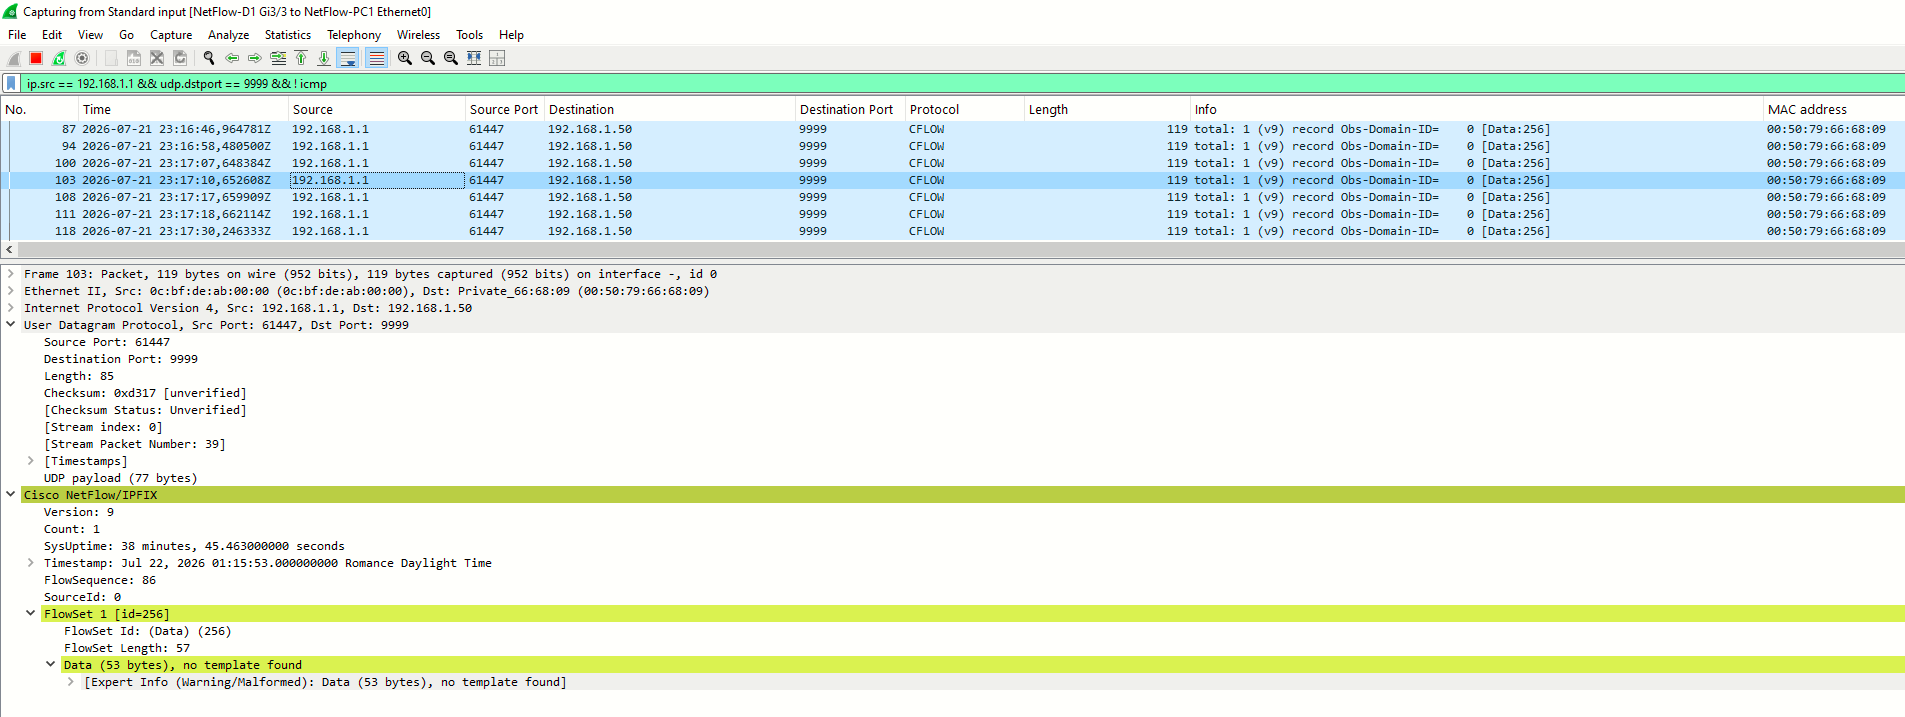
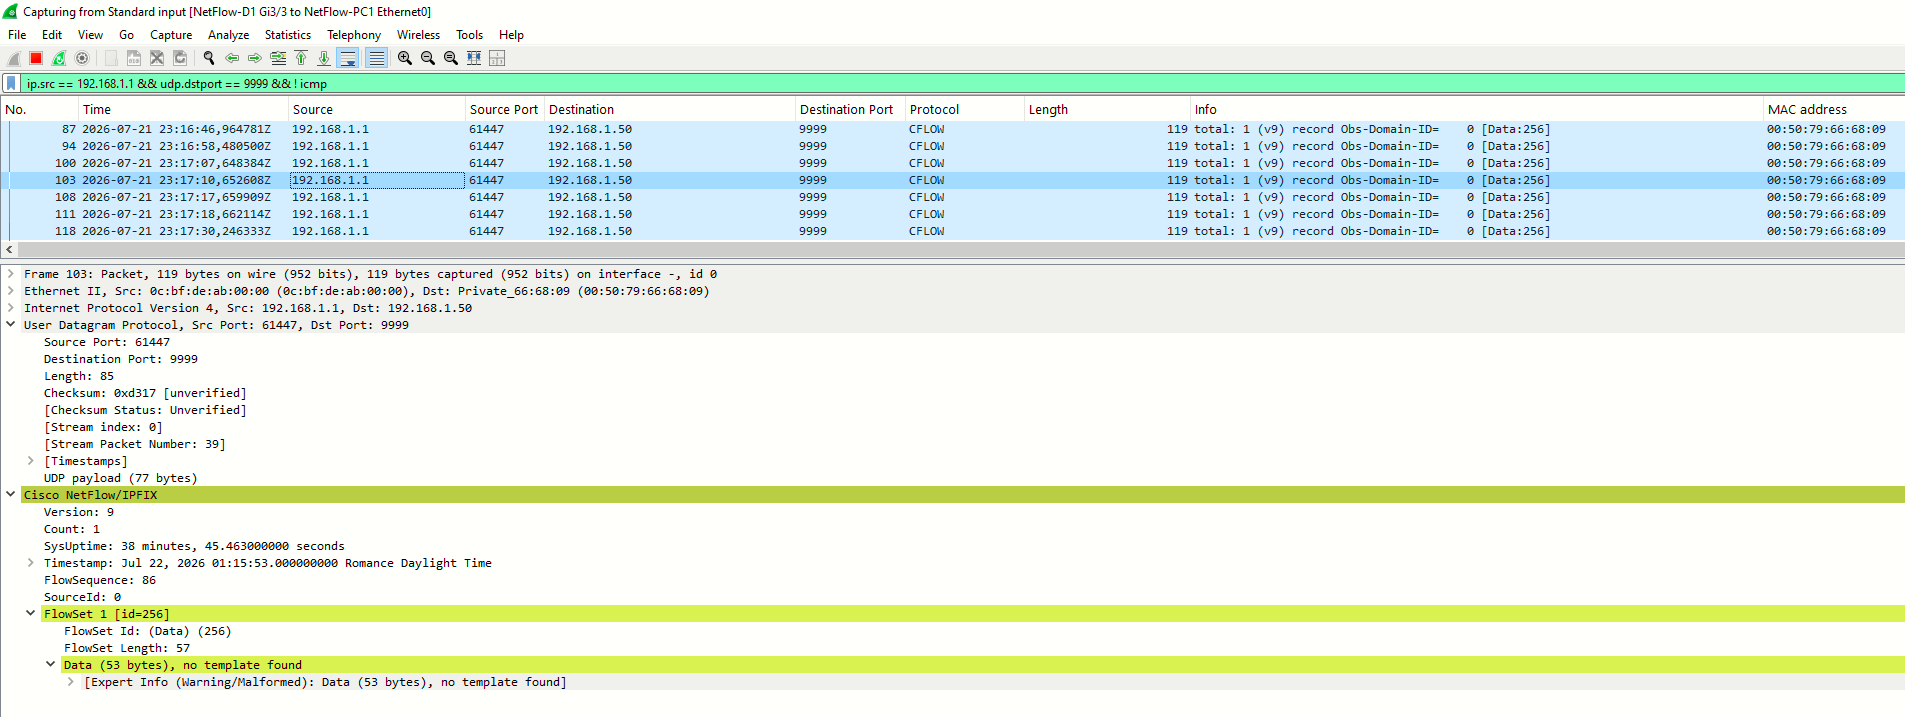
- On PC1-to-D1 link start a packet capture (Wireshark), with the following filter ip.src == 192.168.1.1 && udp.dstport == 9999 && ! icmp, observe traffic matching the filter. Recall that port 9999 is what we configured for transporting NetFlow statistics:
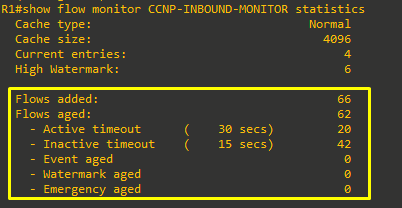
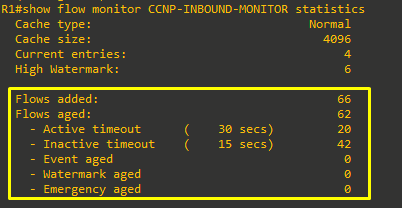
- On R1, issue the command show flow monitor CCNP-INBOUND-MONITOR statistics. Your values for the highlighted statistics will be different.
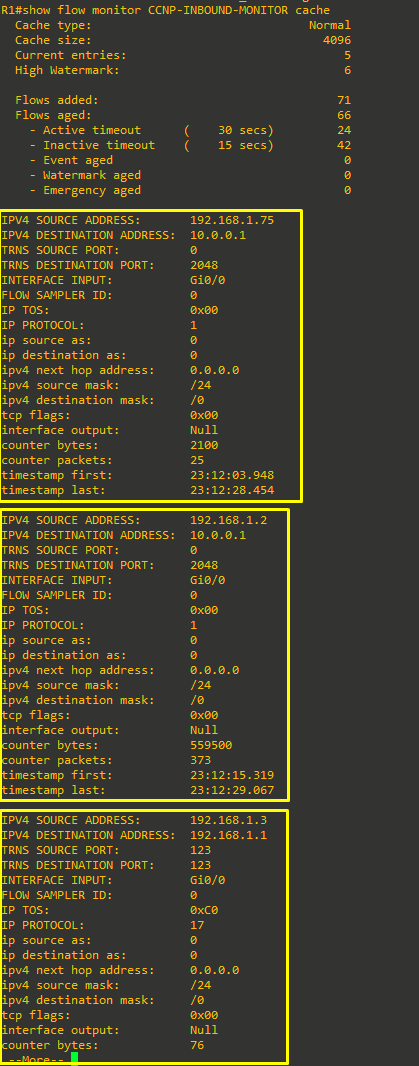
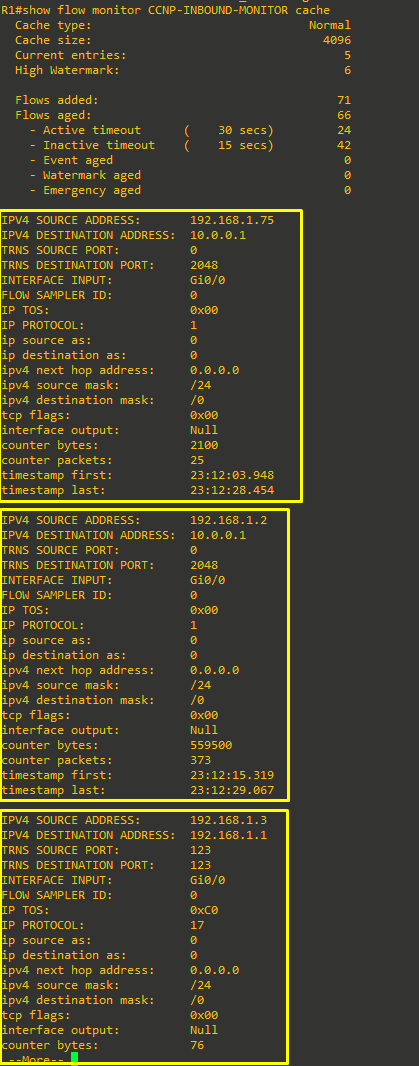
- On R1, issue the command show flow monitor CCNP-INBOUND-MONITOR cache. Note: Output will vary depending upon how long within the 30-second window traffic has been caching.