Lab - Configure Cisco IOS EEM
Topology
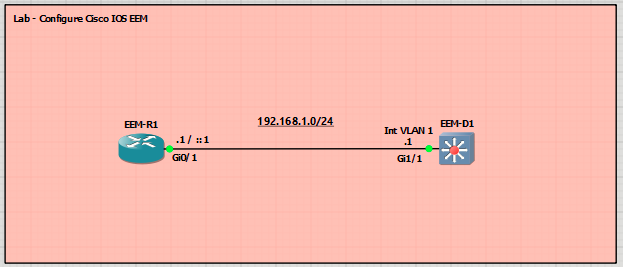
Addressing Table
| Device | Interface | IPv4 Address |
| R1 | G0/1 | 192.168.1.1/24 |
| D1 | G1/1 | 192.168.1.2/24 |
Objectives
- Part 1: Build the Topology and Configure Basic Device Settings and IP Addressing
- Part 2: Configure, Verify, and Test Cisco IOS EEM Applets
Background / Scenario
Embedded Event Manager (EEM) is a flexible system that lets you customize and automate behavior in Cisco IOS, IOS-XR, and NX-OS. Within EEM, you can use either applets or scripts. Applets are simple, router-based “mini-automations” built from CLI commands, while scripts are more advanced programs written in the Tcl (Tool Command Language) scripting language and stored on the device. In both cases, EEM uses event detectors to watch for specific conditions (such as syslog messages or CLI commands), and when a match
occurs, the defined actions (in the applet or script) are run to respond to the event.
Note: Tcl scripts are not used in this lab.
The table lists some of the common event detectors
| Detector | Details |
| SNMP | Monitoring SNMP objects. |
| Syslog | Responds to various syslog messages, allowing for matching on regular expressions. |
| Counter | Monitoring and responding to interface counter when cross threshold settings. |
| CLI events | Screening CLI input for a regular expression match. |
| None | This event detector is used to test the EEM script/applet using "event manager run" command. |
| Timers | (Countdown, watchdog and CRON) |
Actions that can be used are:
- Send an email message.
- Execute a Cisco command.
- Generate an SNMP trap.
- Reload the device.
- Generate prioritized syslog messages.
- Change to a secondary processor in a redundant platform.
- Request system information when the event occurs (examples: show tech, show process, CPU history).
EEM scripts have two purposes:
- To help troubleshoot an issue - When you need to troubleshoot problems of an intermittent nature, EEM scripts can be particularly useful. They allow you to automate the collection process of show command outputs and debug commands which allows you to capture data that would otherwise be extremely hard to gather.
- To help provide a solution - In cases where a temporary workaround is required while the Technical Assistance Center (TAC) does a root cause analysis. For example, a situation where the problem is intermittent, but the reset of an interface fixes the problem. EEM scripts can be used to trigger this action when the problem begins.
In this lab, you will get hands-on practice using Cisco IOS EEM to automatically respond to three specific situations on a router.
Note: This lab is an exercise in configuring options available for Cisco IOS EEM and does not necessarily reflect network troubleshooting best practices.
Required Resources - Sergio Jimenez's Version
For this lab I am using GNS3 where I have deployed:
- 1 IOSv 15.9(3)M9 router
- 1 IOSvL2 15.2 switches
Instructions
Part 1: Configure basic settings for the routers and switches
EEM-R1
hostname R1
no ip domain lookup
username admin secret cisco123
line con 0
exec-timeout 0 0
logging synchronous
exit
line vty 0 4
privilege level 15
password cisco123
exec-timeout 0 0
logging synchronous
login
exit
banner motd # This is R1, Configure Cisco IOS EEM Lab #
interface g0/1
ip address 192.168.1.1 255.255.255.0
no shutdown
end
EEM-D1
hostname D1
no ip domain lookup
no ip routing
username admin secret cisco123
line con 0
exec-timeout 0 0
logging synchronous
exit
line vty 0 4
privilege level 15
password cisco123
exec-timeout 0 0
logging synchronous
login local
exit
banner motd # This is D1, Configure Cisco IOS EEM Lab #
exit
interface range g1/1
no shutdown
exit
interface vlan 1
ip address 192.168.1.2 255.255.255.0
no shutdown
exit
ip default-gateway 192.168.1.1
end
Part 2: Configure, Verify, and Test Cisco IOS EEM Applets
In this part, you will configure and test several Cisco IOS EEM applets on R1. You’ll start by creating an applet that automatically brings an interface back up and logs user information when it is shut down. You will then verify its operation using debugging output. You will add and validate one more applet: one that blocks debug commands while logging who attempted them and when.
Step 1: Implement an EEM script on R1 to monitor for an interface shutdown
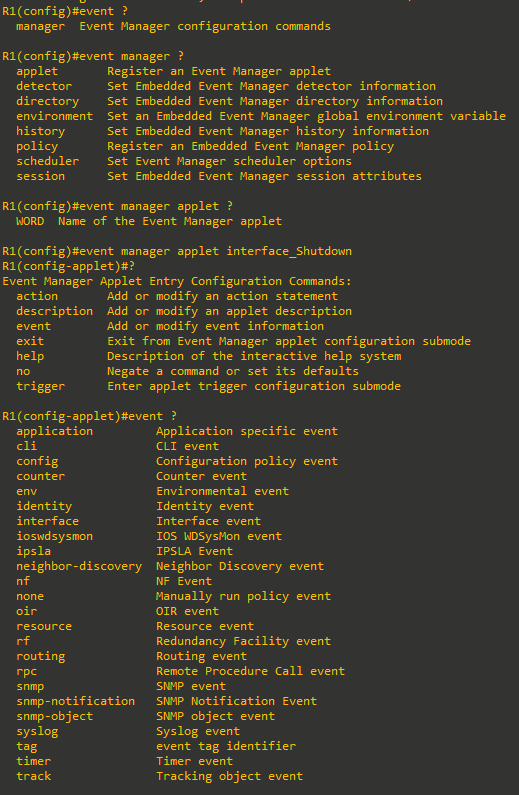
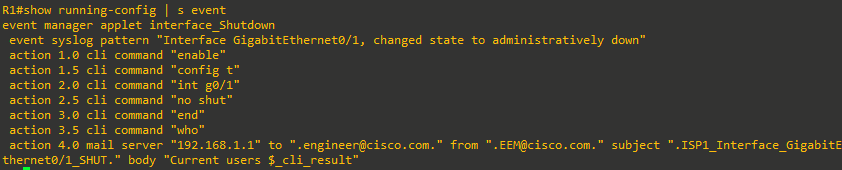
- On R1, configure the EEM script.
Note: The end or exit command is required to finalize the applet.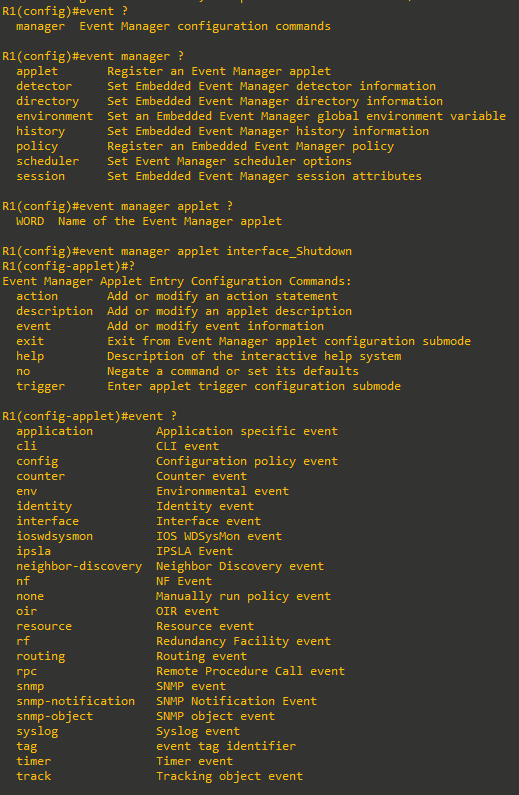
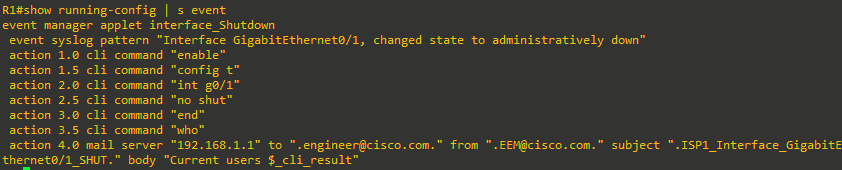
The applet you are creating is called interface_Shutdown. It monitors the router’s syslog messages for the following text:Interface GigabitEthernet0/0/1, changed state to administratively down
When a syslog message containing this exact pattern appears, the applet is triggered and runs its list of actions in order. Those actions automatically enter interface configuration mode, run the no shutdown command to bring the interface back up, and then send an email to a monitoring address that includes information about what happened.
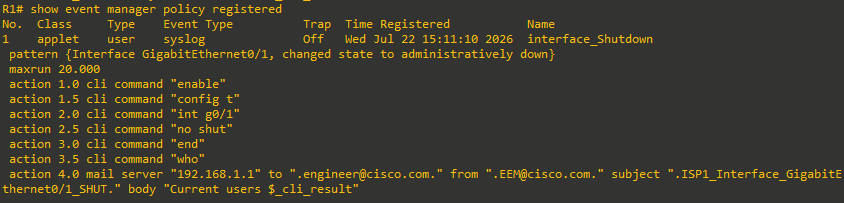
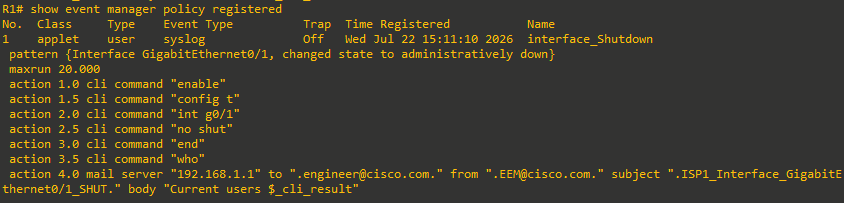
Note: No email will be sent since the lab does not have a configured email server. - Use the show event manager policy registered command to verify that the script has been created successfully in the EEM policy. If you see no output, make sure you entered end in Step 1a.
Step 2: Test the interface_Shutdown applet.
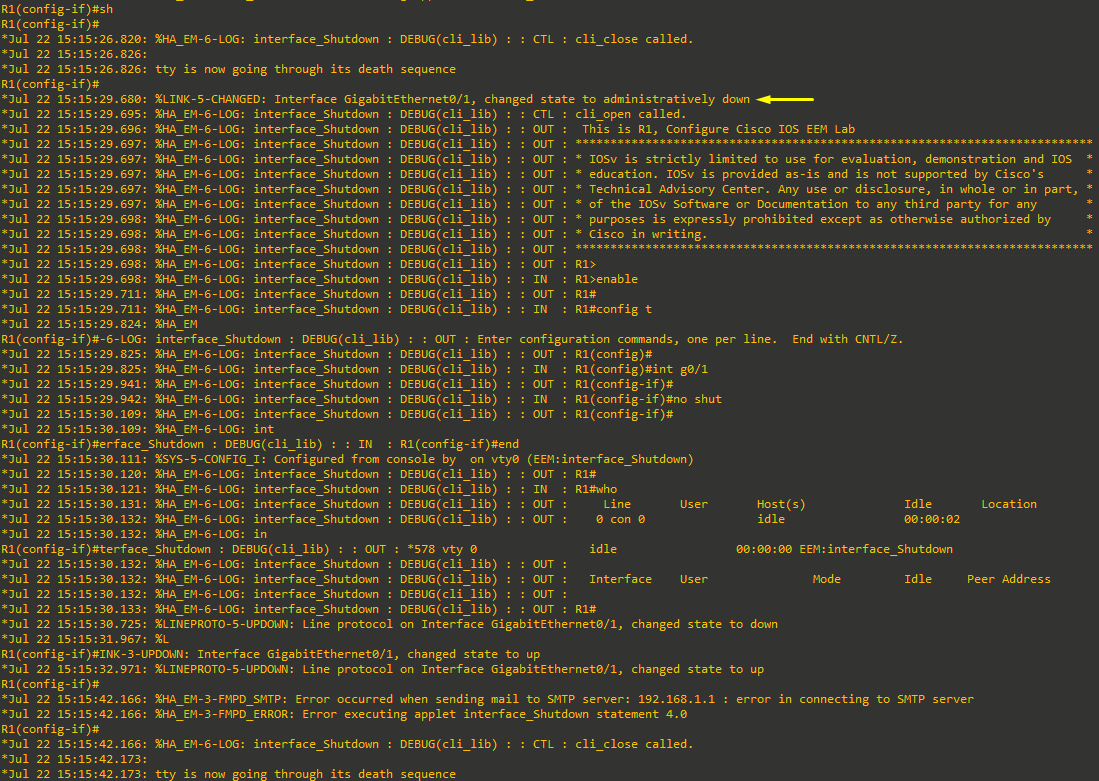
- From the R1 console, enable EEM CLI debugging and trigger the EEM event by shutting down the GigabitEthernet0/1 interface.
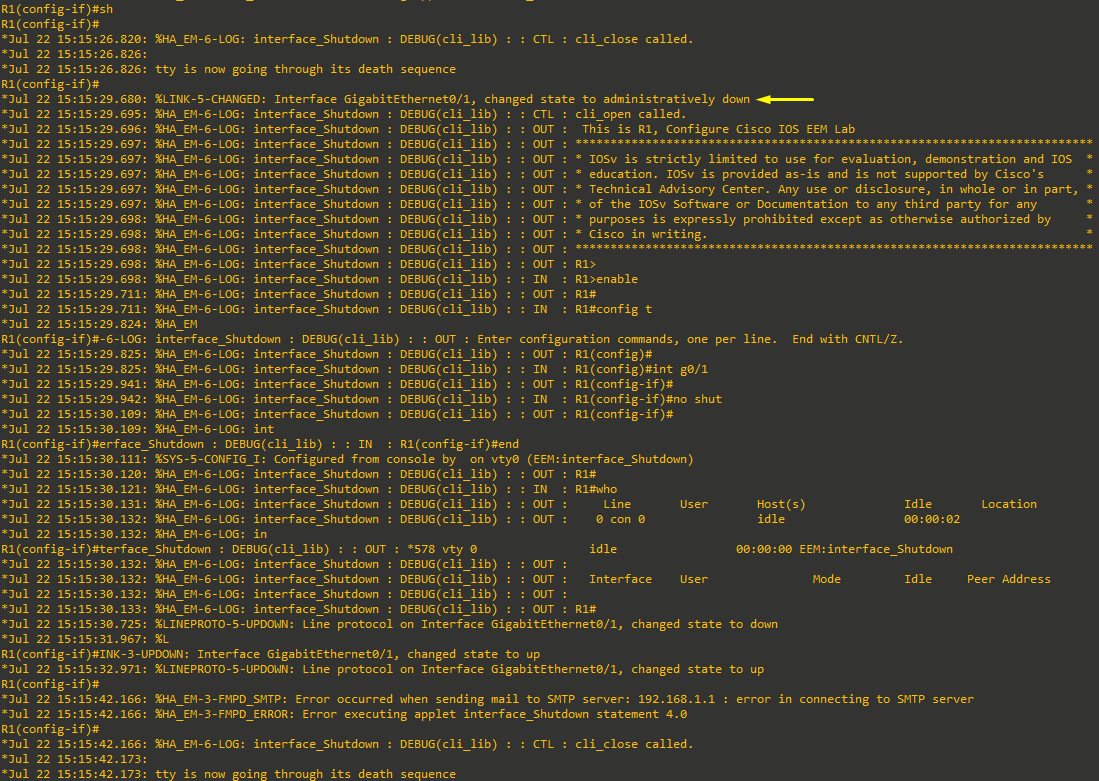
- Evaluate the debug output to see where the actions you defined in the applet where implemented.
Note: The who command shows that it was Con 0 that issued the shutdown command. The email action 4.0 failed, as expected, because there is no SMTP server configured. - Disable all debugging with the undebug all command.
Step 3: Implement an EEM script on R1 to monitor for the debug command
- On R1, configure the EEM script.

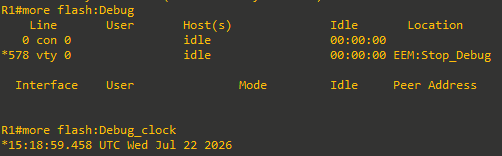
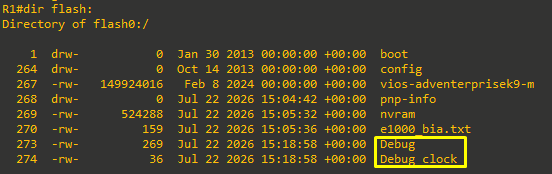
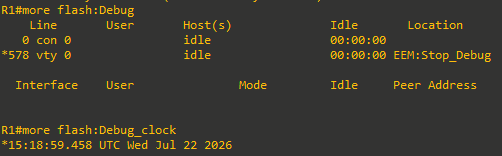
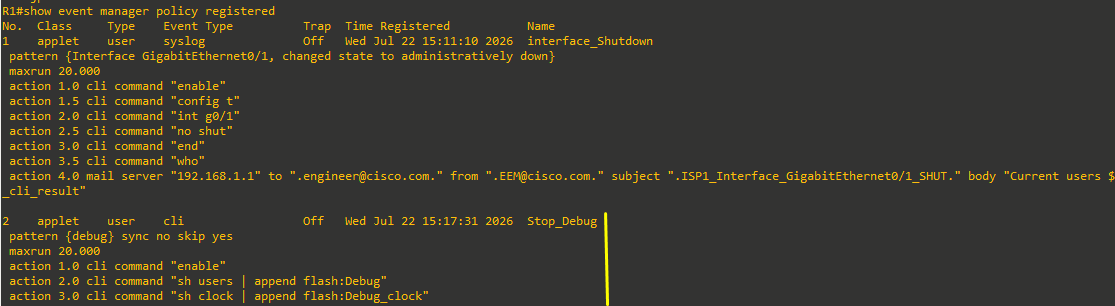
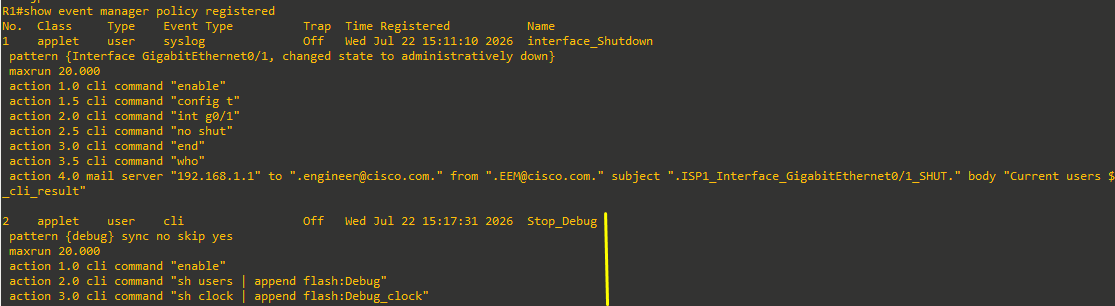
This EEM applet watches all CLI commands entered on the router for the word debug. When a user tries to run any debug command, the applet intercepts it and prevents the debug from running (skip yes). Instead, it first ensures it is in privileged mode, appends the output of show users to a file called Debug in flash (recording who is logged in), and appends the current time from show clock to a second file called Debug_clock. This gives you a simple log of who attempted to use debug and when they did it, without allowing debugging to be enabled. - Use the show event manager policy registered command to verify that the script has been created successfully in the EEM policy. If you see no output, make sure you entered end in Step 3a.

Step 4: Test the Stop_Debug applet
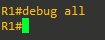
- From the R1 console, trigger the EEM script by entering the debug all command.
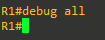
Note that nothing happens - Use the dir command to show the new files created in flash.
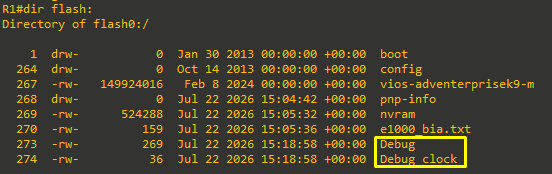
- Use the more command to view the contents of the files created in flash.